Your churn dashboard says 5%. Leadership nods approvingly. The customer success team is hitting their retention targets. Everything looks healthy. Except it is not.
That 5% measures logo churn — the percentage of customers who cancelled. It says nothing about the revenue those customers represented, the accounts that quietly downgraded, or the expansion revenue that never materialized. The vast majority of companies track logo churn exclusively, and in doing so, they miss the metrics that actually predict long-term revenue health.
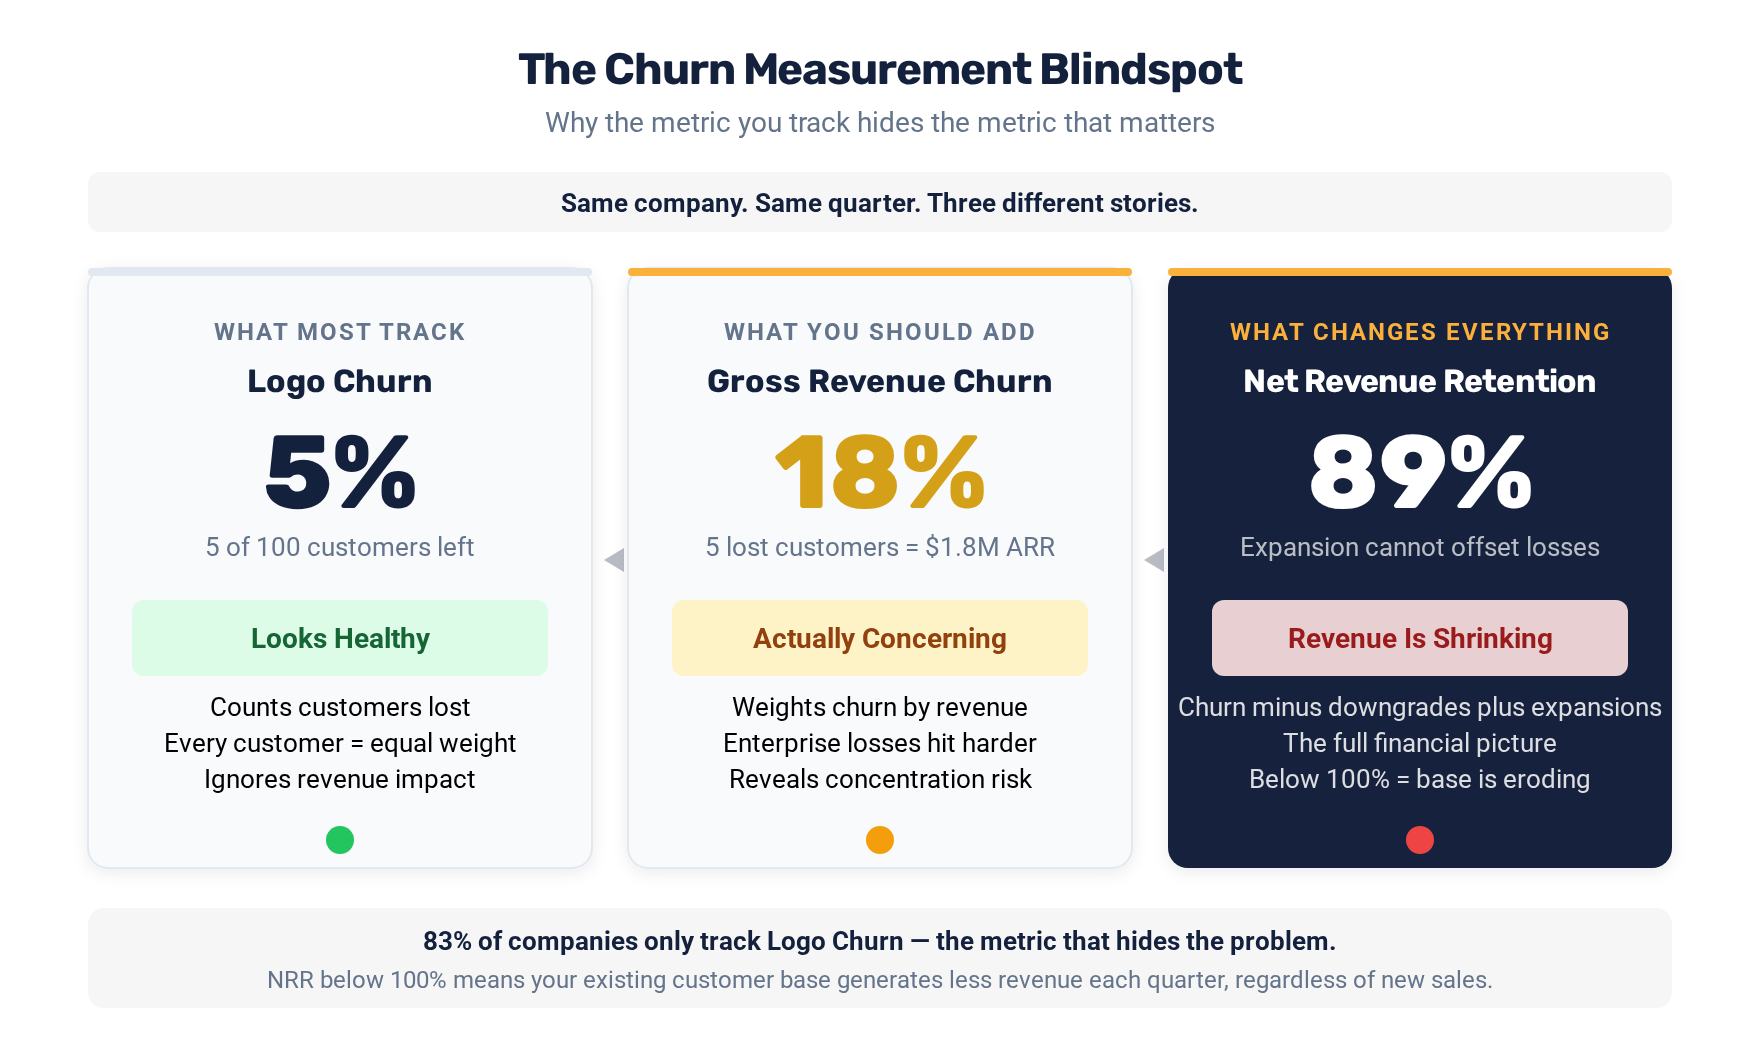
The Three Churn Metrics That Matter
Logo Churn (What You Already Track)
Logo churn counts the number of customers who cancel, divided by total customers. It treats every customer equally — losing a $1,000/year customer and losing a $500,000/year customer both count as one churned logo.
Logo churn is useful for understanding customer satisfaction trends at a high level. It is nearly useless for understanding revenue impact.
Gross Revenue Churn (What You Should Add)
Gross revenue churn measures the total recurring revenue lost from cancellations and downgrades, divided by total recurring revenue at the start of the period. This metric weights churn by its actual financial impact.
If you lose ten $1,000 accounts and zero enterprise accounts, your logo churn might be 5% but your gross revenue churn is less than 1%. Conversely, if you lose one enterprise account worth $500,000, your logo churn might be 0.5% but your gross revenue churn is devastating.
In HubSpot: Track gross revenue churn by building a custom report that sums the recurring revenue of deals that moved to a "Churned" or "Cancelled" deal stage during the period. Compare this against total active recurring revenue at the start of the period.
Net Revenue Retention (What Changes Everything)
Net revenue retention (NRR) accounts for the full picture: revenue lost to churn and downgrades minus revenue gained from expansions and upsells within your existing customer base. An NRR above 100% means your existing customers are generating more revenue over time even after accounting for losses.
NRR is the metric that investors, boards, and sophisticated operators care about most because it measures the compounding value of your customer base. A company with 110% NRR doubles its recurring revenue from existing customers every 7-8 years without acquiring a single new customer.
In HubSpot: Calculate NRR by tracking three deal types on customer records: churned revenue, downgrade revenue, and expansion revenue. Build a custom report that calculates: (Starting Revenue - Churned Revenue - Downgrade Revenue + Expansion Revenue) / Starting Revenue.
Why 83% of Companies Miss This
The percentage of companies that track only logo churn is staggeringly high, and the reasons are structural.
CRM configuration defaults. Most CRMs, including HubSpot, are set up to track deals as discrete events. A new customer is a closed-won deal. When that customer cancels, there is often no standardized process for recording the churn as a revenue event. Companies track the presence or absence of a customer but not the revenue dynamics.
Success teams measured on logos, not revenue. Customer success teams are typically goaled on logo retention and NPS scores. When their incentives are tied to keeping customers active — regardless of account value or growth — they invest equal effort in every account rather than prioritizing based on revenue impact.
Revenue data lives in billing, not CRM. In many organizations, the detailed revenue data — monthly recurring revenue, expansion and contraction by account, upgrades and downgrades — lives in the billing or finance system, not the CRM. The customer success team that owns retention does not have easy access to the revenue data that would reveal the full picture.
Expansion is tracked separately from retention. Many companies treat expansion revenue as a sales function and retention as a customer success function. The organizational separation means nobody is looking at the net picture — the combined impact of churn, contraction, and expansion on existing customer revenue.
The Revenue Churn Blindspot in Action
Here is what the blindspot looks like in practice.
Company A has 200 customers and loses 10 per quarter — a 5% logo churn rate. The 10 lost customers had an average contract value of $5,000. But during the same quarter, 15 remaining customers downgraded from premium to basic plans, reducing their average contract value by $3,000 each.
The dashboard shows: 5% logo churn. Looks fine.
The reality: $50,000 in direct churn + $45,000 in downgrades = $95,000 in lost recurring revenue. If the company's total recurring revenue is $2M, that is 4.75% gross revenue churn per quarter — nearly 20% annualized.
But it gets worse. During the same quarter, expansion revenue from existing customers was only $20,000. Net revenue retention: ($2M - $95,000 + $20,000) / $2M = 96.25%.
Below 100% NRR means the customer base is shrinking in value. The company needs new customer acquisition just to stay flat, and the logo churn metric completely obscured this reality.
Building a Complete Churn Dashboard
Required Data Infrastructure
To track churn properly, you need three things in your CRM:
-
Recurring revenue tracking per account. Each customer record should have a current MRR or ARR property that is updated when contracts change.
-
Revenue event tracking. Every change to a customer's revenue — new contract, expansion, downgrade, cancellation — should be recorded as a separate event with a date, amount, and type.
-
Churn reason categorization. When a customer cancels or downgrades, the reason should be categorized from a standardized dropdown: price, product fit, competitor switch, business closure, budget cut, champion left, poor experience.
In HubSpot, implement this by creating custom deal pipelines for expansion and churn. When a customer expands, create an "Expansion" deal tied to the company record. When a customer churns, create a "Churn" deal. Use custom properties to capture the revenue amount and categorized reason. If the data feeding your churn dashboard is unreliable, the dashboard itself becomes dangerous — the true cost of bad data extends far beyond inaccurate reports.
Key Reports to Build
Monthly revenue churn waterfall. Shows starting revenue, new revenue, expansion revenue, contraction revenue, and churned revenue, arriving at ending revenue. This visual makes the full picture immediately clear.
Churn by customer segment. Break churn by customer size, industry, product line, and tenure. This reveals which segments are healthy and which are leaking.
Churn reason analysis. Categorized churn reasons over time, showing whether the primary drivers are product issues, competitive losses, economic factors, or service failures.
Net revenue retention trend. Monthly NRR plotted over 12 months. The trend matters more than any single month's number.
Revenue at risk. Identify customers showing pre-churn signals — declining usage, decreasing engagement, support escalations, champion departure — and calculate the revenue value at risk. This forward-looking metric is the most actionable because it identifies problems you can still prevent.
Turning Insight Into Action
Once you are measuring churn properly, the interventions become obvious.
Prioritize retention by revenue, not by logo. If a $200,000 account is showing warning signs and a $5,000 account submits a cancellation request, your customer success team should be spending 90% of their energy on the $200,000 account. Logo-based metrics would not distinguish between them. Revenue-based metrics make the priority clear.
Invest in expansion, not just retention. The path to NRR above 100% runs through expansion revenue. Build systematic expansion motions — quarterly business reviews that identify growth opportunities, usage-based triggers that prompt upsell conversations, and success milestones that naturally lead to plan upgrades.
Fix the churn reasons, not just the churn. Categorized churn reasons tell you where to invest. If "champion left" is your top churn reason, you need multi-threading programs that build relationships with multiple stakeholders. If "competitor switch" is the top reason, you need competitive positioning work. If "budget cut" is dominant, you may need to rethink pricing for economic downturns.
The companies that grow most efficiently are not the ones that acquire the most new customers. They are the ones that grow the value of the customers they already have. And you cannot grow what you cannot measure accurately.
For PE portfolio companies, churn visibility is even more critical — operating partners need to see retention metrics across the entire portfolio to identify which investments are at risk. A structured CRM evaluation framework can reveal whether churn signals are being captured or lost.
Keep Reading
- The True Cost of Bad Data — Poor data quality prevents accurate churn analysis.
- PE Portfolio Case Studies — Case studies show churn improvement from better data.
- The Silent Sales-Marketing Divide — Sales-marketing misalignment masks churn signals.
How healthy is your portfolio company's CRM? Take the free assessment — 7 minutes, instant results.